
相关空间: https://huggingface.co/spaces/gradio/chicago-bike-share-dashboard 标签:TABULAR, PLOTS
本指南介绍了如何使用 Gradio 将你的应用程序连接到数据库。 我们将连接到托管在 AWS 上的 PostgreSQL 数据库,但 gradio 完全不知道你要连接的数据库类型及其托管位置。 所以只要你会写 python 代码来连接你的数据,你就可以用 gradio 在 web UI 中显示它 💪
This guide explains how you can use Gradio to connect your app to a database. We will be connecting to a PostgreSQL database hosted on AWS but gradio is completely agnostic to the type of database you are connecting to and where it's hosted. So as long as you can write python code to connect to your data, you can display it in a web UI with gradio 💪
我们将分析来自芝加哥的自行车共享数据。 数据托管在 kaggle here上。 我们的目标是创建一个仪表板,使我们的业务利益相关者能够回答以下问题:
We will be analyzing bike share data from Chicago. The data is hosted on kaggle here. Our goal is to create a dashboard that will enable our business stakeholders to answer the following questions:
电动自行车比普通自行车更受欢迎吗?
Are electric bikes more popular than regular bikes?
最受欢迎的 5 个出发自行车站是哪些?
What are the top 5 most popular departure bike stations?
在本指南的最后,我们将拥有一个功能正常的应用程序,如下所示:
At the end of this guide, we will have a functioning application that looks like this:
我们将把我们的数据存储在托管在 Amazon 的 RDS 服务上的 PostgreSQL 上。 如果你还没有 AWS 账户,请创建一个,并在免费套餐上创建一个 PostgreSQL 数据库。
We will be storing our data on a PostgreSQL hosted on Amazon's RDS service. Create an AWS account if you don't already have one and create a PostgreSQL database on the free tier.
重要提示:如果你计划在 HuggingFace Spaces 上托管此演示,请确保数据库位于端口8080上。 空格将阻止所有传出连接,除非它们是按此处所述连接到端口 80、443 或 8080 的。 RDS 不会让你在端口 80 或 443 上创建 postgreSQL 实例。
Important: If you plan to host this demo on HuggingFace Spaces, make sure database is on port 8080. Spaces will block all outgoing connections unless they are made to port 80, 443, or 8080 as noted here. RDS will not let you create a postgreSQL instance on ports 80 or 443.
创建数据库后,从 Kaggle 下载数据集并将其上传到你的数据库。 为了演示,我们将只上传 2022 年 3 月的数据。
Once your database is created, download the dataset from Kaggle and upload it to your database. For the sake of this demo, we will only upload March 2022 data.
我们将查询我们的数据库以获取按自行车类型(电动、标准或停靠)划分的总骑行次数。 我们还将查询从每个站点出发的游乐设施总数,并取前 5 名。
We will be querying our database for the total count of rides split by the type of bicycle (electric, standard, or docked). We will also query for the total count of rides that depart from each station and take the top 5.
然后,我们将获取查询结果并使用 matplotlib 将其可视化。
We will then take the result of our queries and visualize them in with matplotlib.
我们将使用 pandas read_sql方法连接到数据库。 这需要安装 psycopg2 库。
We will use the pandas read_sql
method to connect to the database. This requires the psycopg2 library to be installed.
为了连接到我们的数据库,我们将指定数据库用户名、密码和主机作为环境变量。 通过避免在我们的应用程序文件中将敏感信息存储为纯文本,这将使我们的应用程序更加安全。
In order to connect to our database, we will specify the database username, password, and host as environment variables. This will make our app more secure by avoiding storing sensitive information as plain text in our application files.
import os
import pandas as pd
import matplotlib.pyplot as plt

DB_USER = os.getenv("DB_USER")
DB_PASSWORD = os.getenv("DB_PASSWORD")
DB_HOST = os.getenv("DB_HOST")
PORT = 8080
DB_NAME = "bikeshare"

connection_string = f"postgresql://{DB_USER}:{DB_PASSWORD}@{DB_HOST}?port={PORT}&dbname={DB_NAME}"

def get_count_ride_type():
    df = pd.read_sql(
    """
        SELECT COUNT(ride_id) as n, rideable_type
        FROM rides
        GROUP BY rideable_type
        ORDER BY n DESC
    """,
    con=connection_string
    )
    fig_m, ax = plt.subplots()
    ax.bar(x=df['rideable_type'], height=df['n'])
    ax.set_title("Number of rides by bycycle type")
    ax.set_ylabel("Number of Rides")
    ax.set_xlabel("Bicycle Type")
    return fig_m

def get_most_popular_stations():

    df = pd.read_sql(
        """
    SELECT COUNT(ride_id) as n, MAX(start_station_name) as station
    FROM RIDES
    WHERE start_station_name is NOT NULL
    GROUP BY start_station_id
    ORDER BY n DESC
    LIMIT 5
    """,
    con=connection_string
    )
    fig_m, ax = plt.subplots()
    ax.bar(x=df['station'], height=df['n'])
    ax.set_title("Most popular stations")
    ax.set_ylabel("Number of Rides")
    ax.set_xlabel("Station Name")
    ax.set_xticklabels(
        df['station'], rotation=45, ha="right", rotation_mode="anchor"
    )
    ax.tick_params(axis="x", labelsize=8)
    fig_m.tight_layout()
    return fig_m
如果你要在本地运行我们的脚本,你可以像这样将你的凭据作为环境变量传递
If you were to run our script locally, you could pass in your credentials as environment variables like so
DB_USER='username' DB_PASSWORD='password' DB_HOST='host' python app.py
我们将在两个单独的 gr.Plot 组件中显示或使用 gr.Row() 并排显示 matplotlib 图。 因为我们已经将获取数据的函数包装在 demo.load() 事件触发器中,所以我们的演示将在每次加载网页时从数据库中动态获取最新数据。 🪄
We will display or matplotlib plots in two separate gr.Plot components displayed side by side using gr.Row().
Because we have wrapped our function to fetch the data in a demo.load() event trigger,
our demo will fetch the latest data dynamically from the database each time the web page loads. 🪄
import gradio as gr

with gr.Blocks() as demo:
    with gr.Row():
        bike_type = gr.Plot()
        station = gr.Plot()

    demo.load(get_count_ride_type, inputs=None, outputs=bike_type)
    demo.load(get_most_popular_stations, inputs=None, outputs=station)

demo.launch()
如果你运行上面的代码,你的应用程序将开始在本地运行。 你甚至可以通过将 share=True 参数传递给 launch 来获得一个临时的可共享链接。
If you run the code above, your app will start running locally.
You can even get a temporary shareable link by passing the share=True parameter to launch.
但是,如果你想要永久部署解决方案怎么办? 让我们将 Gradio 应用程序部署到免费的 HuggingFace Spaces 平台。
But what if you want to a permanent deployment solution? Let's deploy our Gradio app to the free HuggingFace Spaces platform.
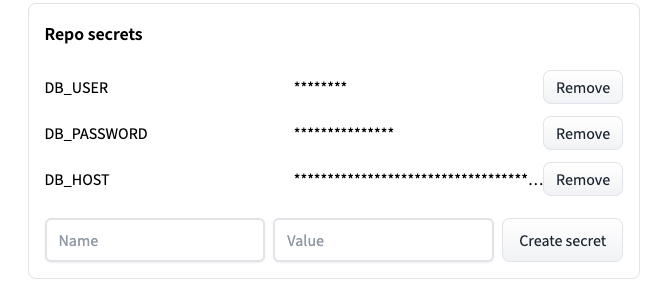
如果你以前没有使用过 Spaces,请在此处按照之前的指南进行操作。 你必须将 DB_USER 、 DB_PASSWORD 和 DB_HOST 变量添加为“Repo Secrets”。 你可以在“设置”选项卡中执行此操作。
If you haven't used Spaces before, follow the previous guide here.
You will have to add the DB_USER, DB_PASSWORD, and DB_HOST variables as "Repo Secrets". You can do this in the "Settings" tab.
恭喜! 你知道如何将你的 gradio 应用程序连接到云端托管的数据库! ☁️
Congratulations! You know how to connect your gradio app to a database hosted on the cloud! ☁️
Our dashboard is now running on Spaces. The complete code is here
如你所见,gradio 使你能够连接到位于任何位置的数据并以你想要的方式显示! 🔥
As you can see, gradio gives you the power to connect to your data wherever it lives and display however you want! 🔥