
标签:表格、仪表板、绘图
Google BigQuery是一种基于云的服务,用于处理非常大的数据集。 它是一种无服务器且高度可扩展的数据仓库解决方案,使用户能够使用类似 SQL 的查询来分析数据。
Google BigQuery is a cloud-based service for processing very large data sets. It is a serverless and highly scalable data warehousing solution that enables users to analyze data using SQL-like queries.
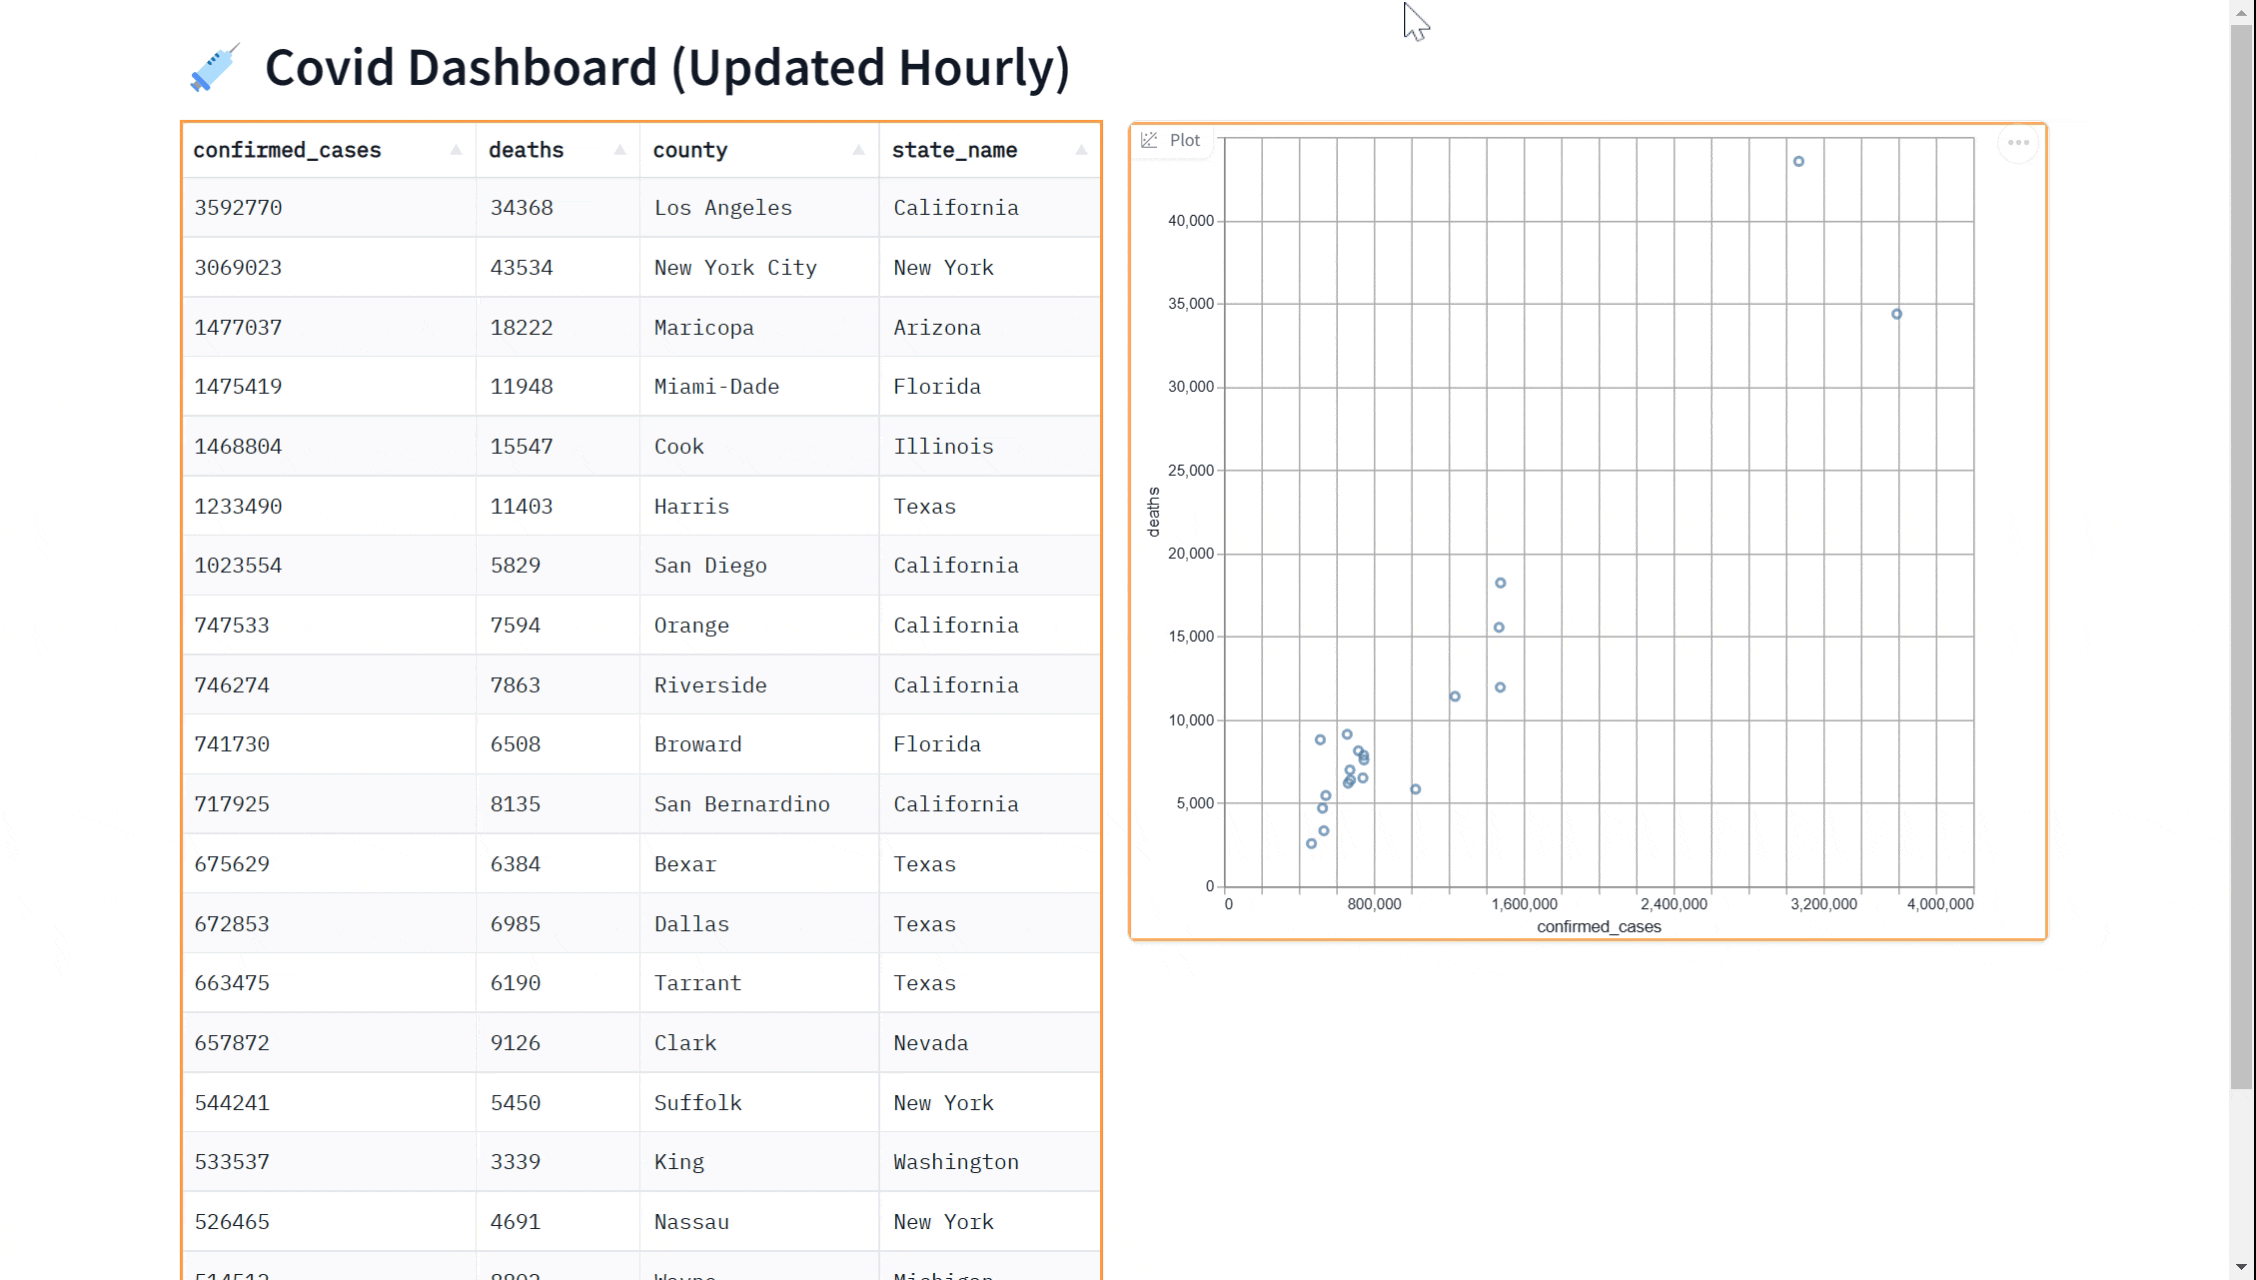
在本教程中,我们将向你展示如何在 Python 中查询 BigQuery 数据集,并使用 gradio 在实时更新的仪表板中显示数据。 仪表板将如下所示:
In this tutorial, we will show you how to query a BigQuery dataset in Python and display the data in a dashboard that updates in real time using gradio. The dashboard will look like this:
我们将在本指南中介绍以下步骤:
We'll cover the following steps in this Guide:
设置你的 BigQuery 凭据
Setting up your BigQuery credentials
使用 BigQuery 客户端
Using the BigQuery client
构建实时仪表板(仅7 行 Python )
Building the real-time dashboard (in just 7 lines of Python)
我们将使用纽约时报的 COVID 数据集,该数据集可作为 BigQuery 上的公共数据集使用。 名为 covid19_nyt.us_counties 数据集包含有关美国各县 COVID 确诊病例和死亡人数的最新信息。
We'll be working with the New York Times' COVID dataset that is available as a public dataset on BigQuery. The dataset, named covid19_nyt.us_counties contains the latest information about the number of confirmed cases and deaths from COVID across US counties.
先决条件:本指南使用Gradio Blocks ,因此请熟悉 Blocks 类。
Prerequisites: This Guide uses Gradio Blocks, so make your are familiar with the Blocks class.
要将 Gradio 与 BigQuery 结合使用,你需要获取 BigQuery 凭据并将其与BigQuery Python 客户端一起使用。 如果你已经拥有 BigQuery 凭据(作为 .json 文件),则可以跳过此部分。 如果没有,你可以在几分钟内免费完成此操作。
To use Gradio with BigQuery, you will need to obtain your BigQuery credentials and use them with the BigQuery Python client. If you already have BigQuery credentials (as a .json file), you can skip this section. If not, you can do this for free in just a couple of minutes.
首先,登录你的 Google Cloud 帐户并转到 Google Cloud Console ( https://console.cloud.google.com/\ )
First, log in to your Google Cloud account and go to the Google Cloud Console (https://console.cloud.google.com/)
在 Cloud Console 中,点击左上角的汉堡菜单,然后从菜单中选择“API 和服务”。 如果你没有现有项目,则需要创建一个。
In the Cloud Console, click on the hamburger menu in the top-left corner and select "APIs & Services" from the menu. If you do not have an existing project, you will need to create one.
然后,单击“+ Enabled APIs & services”按钮,它允许你为项目启用特定服务。 搜索“BigQuery API”,单击它,然后单击“启用”按钮。 如果你看到“管理”按钮,则说明 BigQuery 已启用,一切就绪。
Then, click the "+ Enabled APIs & services" button, which allows you to enable specific services for your project. Search for "BigQuery API", click on it, and click the "Enable" button. If you see the "Manage" button, then the BigQuery is already enabled, and you're all set.
在 API 和服务菜单中,单击“凭据”选项卡,然后单击“创建凭据”按钮。
In the APIs & Services menu, click on the "Credentials" tab and then click on the "Create credentials" button.
在“创建凭据”对话框中,选择“服务帐户密钥”作为要创建的凭据类型,并为其命名。 还可以通过授予服务帐户权限(例如“BigQuery 用户”)来授予服务帐户权限,这将允许你运行查询。
In the "Create credentials" dialog, select "Service account key" as the type of credentials to create, and give it a name. Also grant the service account permissions by giving it a role such as "BigQuery User", which will allow you to run queries.
选择服务帐户后,选择“JSON”密钥类型,然后单击“创建”按钮。 这会将包含你的凭据的 JSON 密钥文件下载到你的计算机。 它看起来像这样:
After selecting the service account, select the "JSON" key type and then click on the "Create" button. This will download the JSON key file containing your credentials to your computer. It will look something like this:
{
 "type": "service_account",
 "project_id": "your project",
 "private_key_id": "your private key id",
 "private_key": "private key",
 "client_email": "email",
 "client_id": "client id",
 "auth_uri": "https://accounts.google.com/o/oauth2/auth",
 "token_uri": "https://accounts.google.com/o/oauth2/token",
 "auth_provider_x509_cert_url": "https://www.googleapis.com/oauth2/v1/certs",
 "client_x509_cert_url":  "https://www.googleapis.com/robot/v1/metadata/x509/email_id"
}
获得凭据后,你将需要使用 BigQuery Python 客户端使用你的凭据进行身份验证。 为此,你需要通过在终端中运行以下命令来安装 BigQuery Python 客户端:
Once you have the credentials, you will need to use the BigQuery Python client to authenticate using your credentials. To do this, you will need to install the BigQuery Python client by running the following command in the terminal:
pip install google-cloud-bigquery[pandas]
你会注意到我们已经安装了 pandas 插件,这将有助于将 BigQuery 数据集作为 pandas 数据框进行处理。 安装客户端后,你可以通过运行以下代码使用你的凭据进行身份验证:
You'll notice that we've installed the pandas add-on, which will be helpful for processing the BigQuery dataset as a pandas dataframe. Once the client is installed, you can authenticate using your credentials by running the following code:
from google.cloud import bigquery

client = bigquery.Client.from_service_account_json("path/to/key.json")
通过验证凭据后,你现在可以使用 BigQuery Python 客户端与 BigQuery 数据集进行交互。
With your credentials authenticated, you can now use the BigQuery Python client to interact with your BigQuery datasets.
下面是一个函数示例,它查询 BigQuery 中的 covid19_nyt.us_counties 数据集,以显示截至当天确诊病例最多的前 20 个县:
Here is an example of a function which queries the covid19_nyt.us_counties dataset in BigQuery to show the top 20 counties with the most confirmed cases as of the current day:
import numpy as np

QUERY = (
    'SELECT * FROM `bigquery-public-data.covid19_nyt.us_counties` '
    'ORDER BY date DESC,confirmed_cases DESC '
    'LIMIT 20')

def run_query():
    query_job = client.query(QUERY)
    query_result = query_job.result()
    df = query_result.to_dataframe()
    # Select a subset of columns
    df = df[["confirmed_cases", "deaths", "county", "state_name"]]
    # Convert numeric columns to standard numpy types
    df = df.astype({"deaths": np.int64, "confirmed_cases": np.int64})
    return df
一旦有了查询数据的功能,就可以使用 Gradio 库中的 gr.DataFrame 组件以表格格式显示结果。 这是检查数据并确保已正确查询数据的有用方法。
Once you have a function to query the data, you can use the gr.DataFrame component from the Gradio library to display the results in a tabular format. This is a useful way to inspect the data and make sure that it has been queried correctly.
下面是如何使用 gr.DataFrame 组件显示结果的示例。 通过将 run_query 函数传递给 gr.DataFrame ,我们指示 Gradio 在页面加载后立即运行该函数并显示结果。 此外,你还传入关键字 every 以告诉仪表板每小时(60*60 秒)刷新一次。
Here is an example of how to use the gr.DataFrame component to display the results. By passing in the run_query function to gr.DataFrame, we instruct Gradio to run the function as soon as the page loads and show the results. In addition, you also pass in the keyword every to tell the dashboard to refresh every hour (60*60 seconds).
import gradio as gr

with gr.Blocks() as demo:
    gr.DataFrame(run_query, every=60*60)

demo.queue().launch()  # Run the demo using queuing
也许你想向我们的仪表板添加可视化效果。 你可以使用 gr.ScatterPlot() 组件在散点图中可视化数据。 这使你可以查看不同变量之间的关系,例如数据集中的病例数和病例死亡数,并且有助于探索数据和获得见解。 同样,我们可以通过传入 every 参数来实时执行此操作。
Perhaps you'd like to add a visualization to our dashboard. You can use the gr.ScatterPlot() component to visualize the data in a scatter plot. This allows you to see the relationship between different variables such as case count and case deaths in the dataset and can be useful for exploring the data and gaining insights. Again, we can do this in real-time
by passing in the every parameter.
这是一个完整的示例,展示了除了使用 gr.DataFrame 显示数据之外,如何使用 gr.ScatterPlot 进行可视化
Here is a complete example showing how to use the gr.ScatterPlot to visualize in addition to displaying data with the gr.DataFrame
import gradio as gr

with gr.Blocks() as demo:
    gr.Markdown("# 💉 Covid Dashboard (Updated Hourly)")
    with gr.Row():
        gr.DataFrame(run_query, every=60*60)
        gr.ScatterPlot(run_query, every=60*60, x="confirmed_cases",
                        y="deaths", tooltip="county", width=500, height=500)

demo.queue().launch()  # Run the demo with queuing enabled